15 touchpoints before a demo: what senior B2B buyers do before they raise their hand
At Roo and Eve, we recently reviewed one client's attribution data and counted the touchpoints before a single MQL converted: 15 blog posts, 2 case studies, a LinkedIn post from 6 months earlier, and a competitor comparison page.
One buyer. Nineteen pieces of content. Over 12 months. 👀
That's what a converting B2B buyer actually does. (And almost no one is building the right content for it.)
Most B2B marketing teams are still measuring content like it's 2018. Traffic as the headline number, conversion rate as the success metric, and a 90-day window for everything. Which is why so many senior leaders think content isn’t worth properly investing in.
The 97% problem: B2B buyer statistics and the Day One shortlist
I’ve said this a thousand times, but it’s worth mentioning again: at any given moment, only around 3%-5% of your market is actively buying.
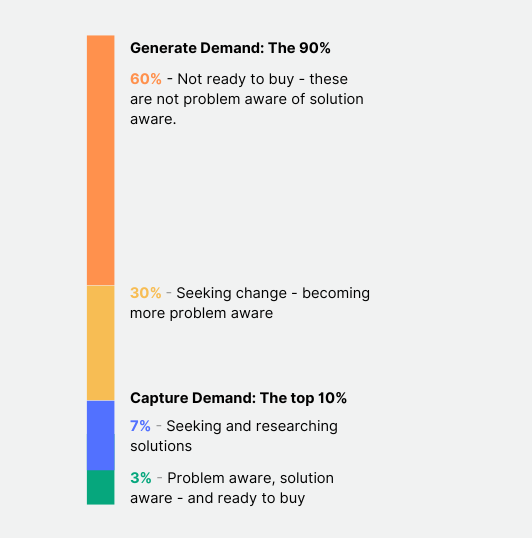
The other 97% are doing something messier.
They're moving through an average of 88 touchpoints across 10 stakeholders, with about 61% of that activity happening anonymously before sales hears a word. By the time they raise their hand, they've already decided who they're going to consider.
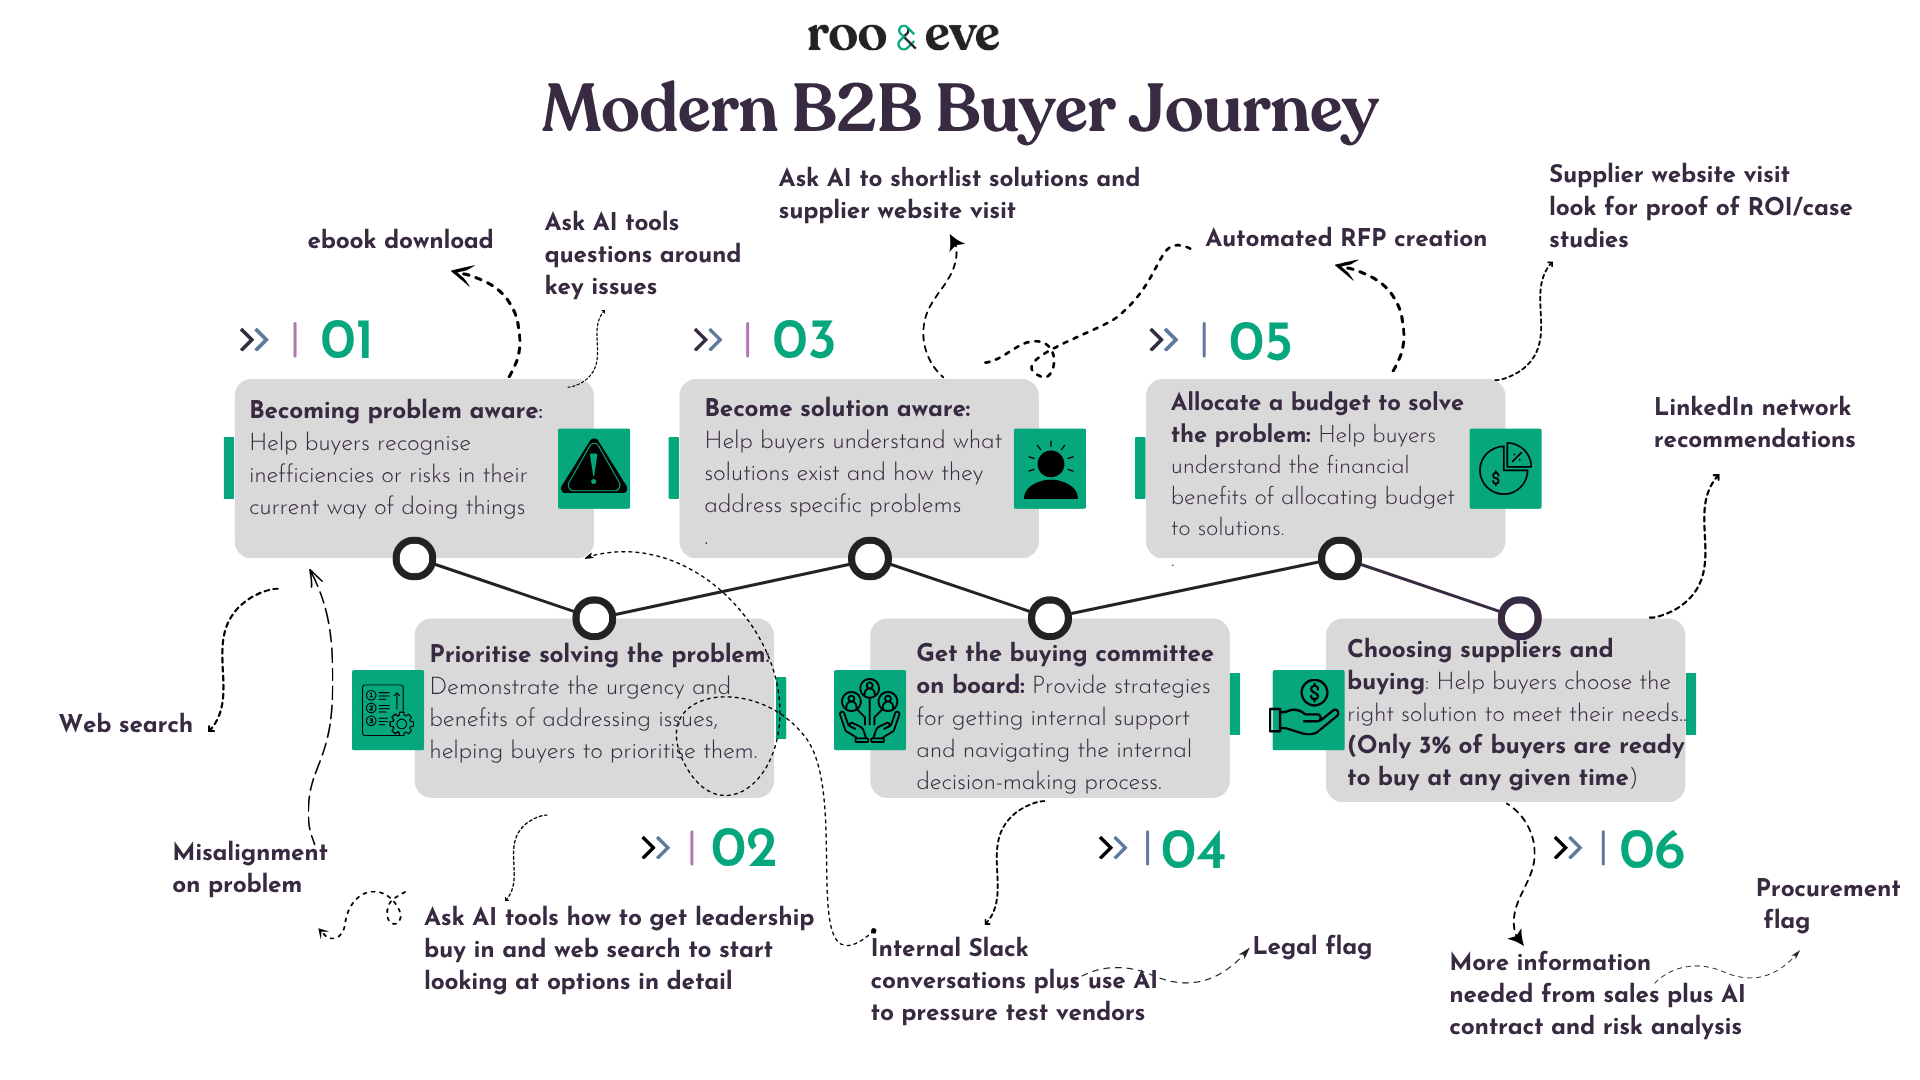
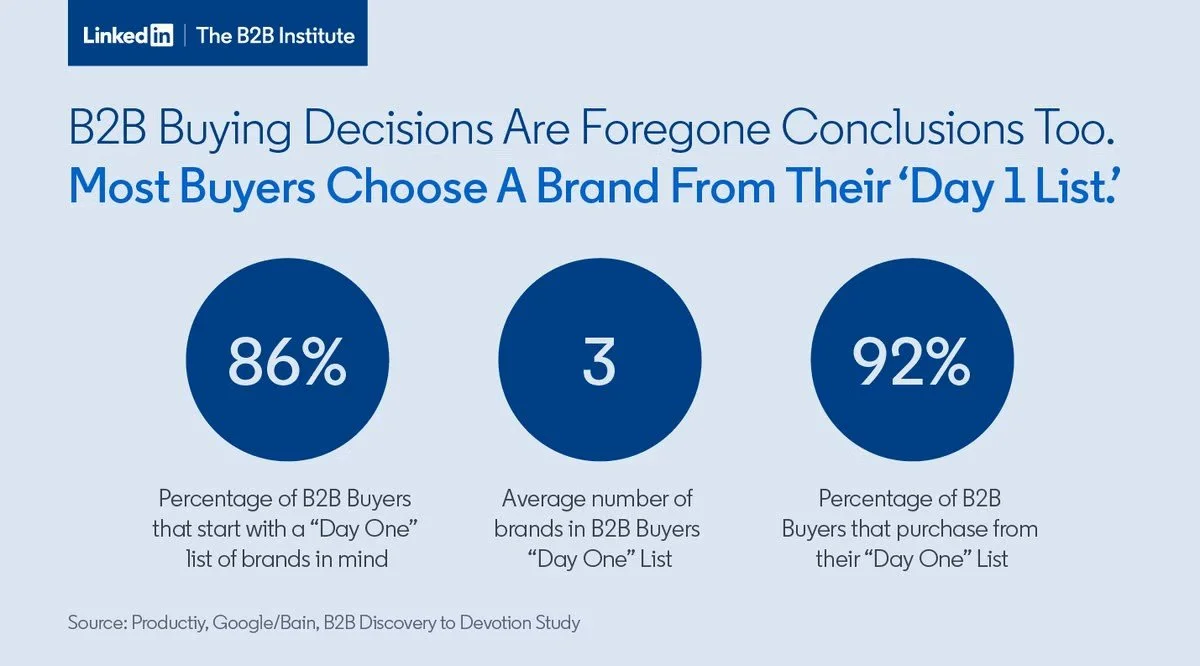
Bain put a number on it: 86% of buyers walk into a formal buying process with their shortlist drawn up. 6sense's research goes further. Buyers typically put roughly four vendors on the initial shortlist, and 95% of the time they buy from one of the original four.
If you're not on the shortlist before the buying cycle starts, your odds of winning the deal drop to 10% or lower. The LinkedIn B2B Institute calls this the First Impression Rose. It's the most important concept in B2B marketing right now, and it's also the one most marketing teams are ignoring. As LinkedIn puts it;
“Although the B2B Buyer’s “journey” is long and can take months, if not years, before they sign a contract, 86% of Buyers already have their choices predetermined on Day One. Of all the thousands of brands that B2B Buyers could consider, they typically only shortlist ~3 to 4 brands to evaluate. On top of that, 92% of Buyers with a “Final Four” will eventually give their “Final Rose” to one of the brands they shortlisted from Day One.”
None of this research is new. What's new is how many directors still don’t believe it isn't true because their dashboard won't let them act on it.
The dashboard rewards demos booked this quarter. It doesn’t reward being the brand a CFO mentioned to her CIO on a Tuesday in February, eight months before she opened a procurement form.
Content attribution data: Analysing B2B view-to-MQL cycles
When we look at attribution data across our clients, we see the same thing time and again. Converting B2B prospects touch 15 to 25 pieces of content before they raise their hand. Sometimes more. The time from first content view to MQL averages anywhere from 200 to 660 days, depending on the size of the deal and the seniority of the buyer.
In one recent client, blogs influenced roughly a third of all MQLs in a single quarter, contributing over £500k of influenced pipeline value. (That's from first-party multi-touch attribution data, not vanity metrics.)
And here's the part that breaks most measurement models.
The blogs with the highest influence on pipeline are often the ones with the lowest traffic.
I'm talking about pieces pulling fewer than 10 sessions a quarter that appear inside 20 or more converting buyer journeys.
When you see a piece of content only pulling in a handful of views, the instinct is to assume it's underperforming and retire it. The reality can be quite the opposite! The piece has already proved it influences pipeline. It often just needs more readers.
So a few things start to become more important than they did before:
Variety matters more than volume. Converting buyers don't read five versions of the same blog. They read a maturity model, a comparison piece, a definitional explainer, a cost-of-inaction piece, and a customer story. Each piece does different work at a different point in the cycle.
Traffic is a proxy for reach. Influence is a proxy for fit. They're measuring different things, and most B2B teams are only watching the first one.
The highest-influence pieces are usually those that deserve paid amplification, sales enablement use, and internal sharing.
This is the conversation marketing teams have all the time. The strategy is sound. The content is doing its job. The opportunity is in what happens after a piece is published — and whether the budget exists to put it in front of more of the right people.
A blog with single-digit sessions and twenty converting buyer journeys is the marker of a content programme that's already working, with room to compound if you back it.
Dark social and AI: B2B buyer behaviour you can’t track
Here's the structural problem with most content measurement: it can only count the bits of buyer behaviour that leave a trail.
A pageview leaves a trail, a form fill leaves a trail, and a click from LinkedIn leaves a trail. But buyers are increasingly consuming content in places that don't generate any trail. The behaviour is real, and the influence on the buying decision is real, but the data is often invisible.
Some of what's happening right now:
LLMs are absorbing informational queries. Buyers are using ChatGPT, Perplexity and Claude as private research assistants, asking which vendors to consider, comparing approaches, building shortlists. The answer gets generated from whatever public content the model has been trained on. No cookies, no form fills, no click-through. If your point of view isn't out there, your competitors' is, and the LLM will recommend them by default.
Google AI Overviews are answering questions on the search results page. Definitional and informational content that used to drive top-of-funnel traffic now produces an AI summary instead. The buyer reads it and moves on. You don't get the session, but you do get cited if your content is the source.
LinkedIn dwell is invisible. Buyers read posts in-feed, absorb a point of view over months, and never click through to your site. Your dashboard shows zero sessions from LinkedIn that week. The reality is that three people in a buying committee just read your last four posts back-to-back; they just didn’t ‘like’ it.
Dark social is doing real work. Peer recommendations move through Slack channels, WhatsApp groups and internal emails. Your analytics shows direct traffic. The actual source is a CFO forwarding a link to her CIO.
None of this means content isn't working. It means more of it is working in places you can't measure.
Which is why "what does our dashboard show" is the wrong question. The better one is: "if we stopped publishing tomorrow, where would the gap show up and how long until we noticed?"
The honest answer, for most B2B brands, is about 12 to 18 months. Which is roughly the length of the average buying cycle for a senior decision. Coincidence? Probably not.
Why most content metrics fail B2B content strategies
View-to-lead cycles for considered B2B purchases run anywhere from 200 to 660 days. The Day One shortlist is built across months, even years. The deal that closes in March was influenced by content published the previous June.
Now look at how most B2B teams report on content: monthly traffic, quarterly pipeline contribution, annual budget reviews tied to the last twelve months. Which means the content invested this quarter might not show in pipeline until next year. The content shown in the pipeline this quarter was invested in last year.
So when the CFO asks "what did content contribute to Q1?" and the dashboard shows pieces with low session counts and no direct conversions, the obvious answer is to cut budget. Which guarantees a gap in pipeline twelve months from now.
It also misses two of the things that make content compound in the first place.
The first is consistency. Brands that publish every month are the ones that show up in buyers' research over time. Sporadic publishing — a flurry of activity in Q1, a quiet Q2, three pieces in September because someone remembered the content plan — doesn't compound. It just costs money. The Day One shortlist forms in the heads of buyers who've seen you turn up consistently for twelve, eighteen, twenty-four months. You can't fake that with a launch and a gap.
The second is freshness. A blog published two years ago that's still ranking, still getting cited, still appearing in buyer journeys, isn't doing that by accident. It needs updating. Stats go out of date. Examples get tired. The buyers reading it in 2026 aren't the same buyers who read it in 2024. Refreshing your highest-influence pieces is one of the highest-leverage content moves a B2B team can make.
Your quick checklist: Content strategies that work in 2026
If you’re keen to make your content work harder, here’s a quick checklist for B2B marketing teams who want to stop punishing the content that's working.
#1. Look at influence, not just traffic
Pull the list of blogs that appear in the journeys of converting accounts in the last 12 months
Pull the list of blogs that got the most sessions in the same period
Compare the two. The pieces on the first list and not the second are your strategic assets
Flag them. And for the love of god, stop judging them on pageviews
#2. Audit your content variety
List every piece published in the last 12 months
Tag each one by stage: definitional, maturity model, comparison, thought leadership, customer story, cost-of-inaction
Look for gaps. If 80% of your output is one type, you're feeding one stage and starving the others
Brief in pieces that fill the gaps before commissioning more of what you already have
#3. Publish consistently
Commit to a minimum monthly publishing cadence and protect it
Build the editorial calendar 90 days ahead, not 30
Don't let Q2 quiet periods or Q4 launches break the rhythm. The compound effect needs consistency!
If budget gets cut mid-year, cut elsewhere first
#4. Refresh what's working
Identify your top 10 highest-influence pieces from step one
Refresh them every 6-12 months, including stats, examples, angle, and internal links
Treat refreshes as equal in value to net-new pieces, because they often are
Amplify the refreshed versions to the same audiences who engaged the first time
#5. Plan on the right time horizon
Find out your average view-to-lead cycle.
Set content KPIs that match that horizon, not the quarterly reporting one
Brief your CFO on why content invested today shows up in pipeline 12+ months later
Build a measurement framework that defends multi-year investment in quarterly reviews
#6. Amplify your highest-influence pieces
Identify the pieces with high pipeline influence and low traffic
Put paid budget behind them on channels like LinkedIn — these are proven to land with the right accounts
Equip sales with them as enablement assets
Share them in internal channels — your own team should be amplifying the work too
Key takeaway: Compounding content for the Day One list
The key takeaway: Those winning the Day One shortlist are publishing the right content, consistently, for long enough that the work compounds.
Most of your competitors are still running the old playbook. Which is good news, if you're willing to stop running it too!
Want help creating revenue generating content?
We work with B2B data and tech companies to build content programmes that influence pipeline across the full buying cycle. If you want your content to work harder, get in touch. We’d genuinely love to help.